
Move over Halloween: the scariest specter this October just might be the onslaught of apocalyptic political ads leading up to the 2022 midterm elections. Whether it’s through TV commercials, political mailers or text messages, the purported horror of this year’s political candidates is impossible to avoid. Mixed in with the mudslinging are dire warnings that an opposition win spells certain disaster for the markets. If this year’s election has you spooked, keep reading.
Like many potential market disruptions, long-term investor should be wary of making short-term changes based on perceived election results. Consider the 2016 presidential outcome. Analysts, such as the ones cited in a CNN Business article that ran shortly before election day, predicted a sharp market downturn if Donald Trump were elected. Conventional polling, however, pointed to a Hilary Clinton victory. Uncertainty and fear motivated some investors (on both sides of the aisle) to move investments into cash. Of course, we now know how inaccurate both those predictions were, and those with money sitting in cash missed a significant market bounce.
Midterm Election Months
Midterm elections are no different. Despite the lack of a presidential candidate, 100% of Representatives and 33% of Senators are up for reelection. With potential for significant political demographic shifts, it’s easy to be concerned about possible market influence. Past performance is certainly not a guarantee of future results, but when we analyze historic data, the market does not perform exceptionally differently during midterm election months than it does in non-election months.
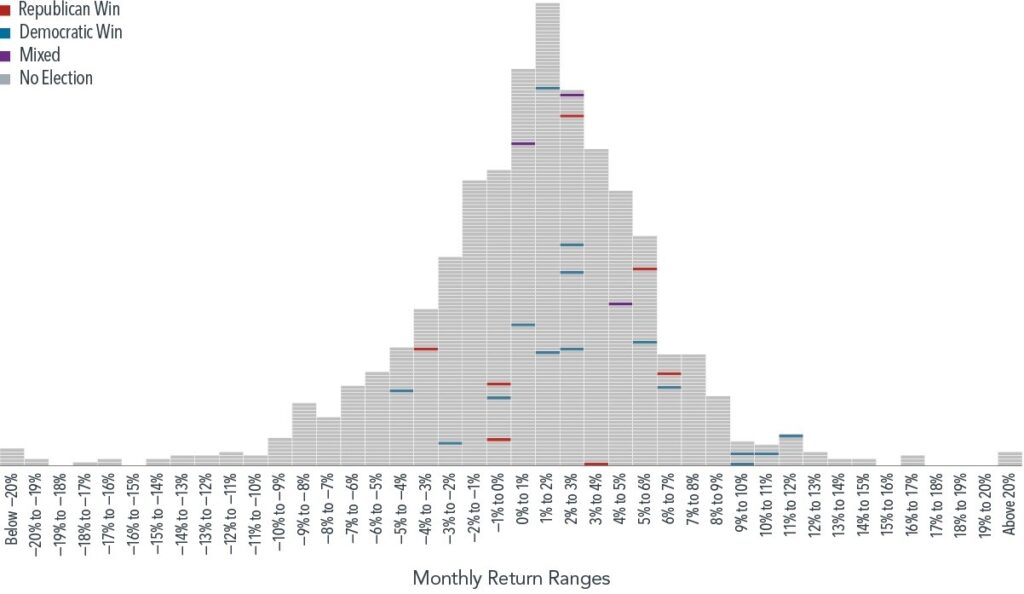
Consider the histogram below showing monthly market returns from January 1926 to June 2022. Midterm election months are represented by the blue, red and purple rectangles. The blue, red and purple denote Democratic, Republican or split control of Congress respectively. Regardless of election results, midterm election months have all fallen within a typical range of performance outcomes.
Monthly Return Range Histogram
 S&P data © 2022 S&P Dow Jones Indices LLC, a division of S&P Global. Graph produced by Dimensional Fund Advisors. All rights reserved.
Annual Returns
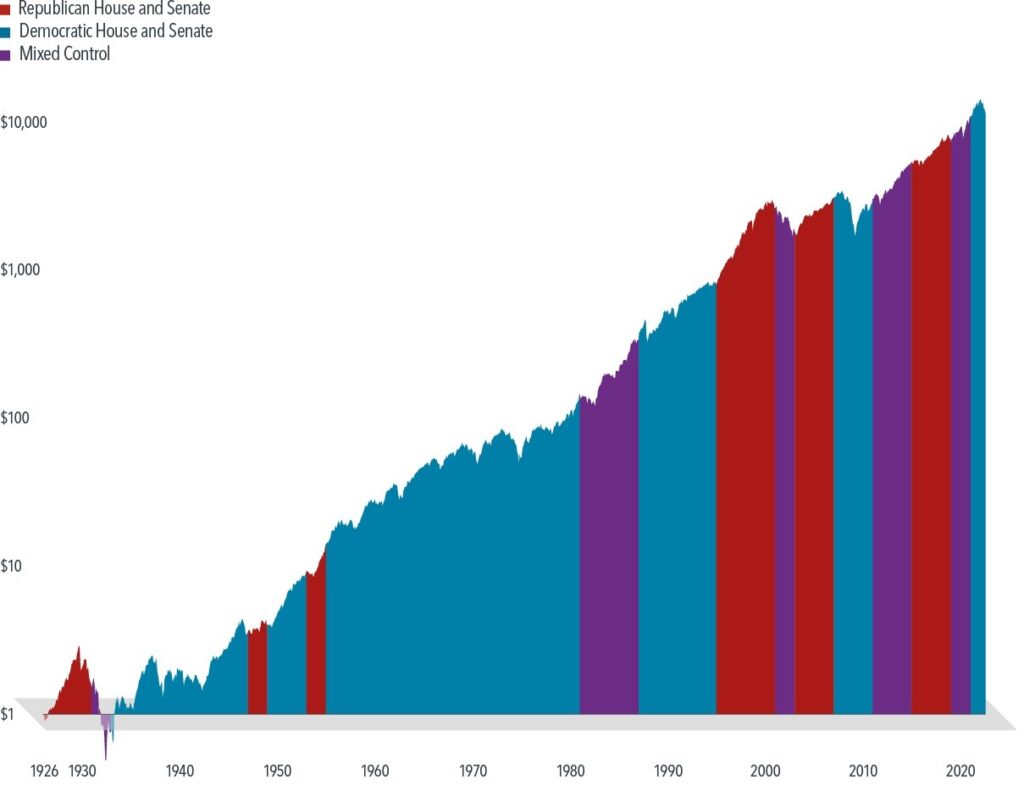
Likewise, when we look at long-term historic performance of the market separated by party control of Congress, there is not a substantial difference. The chart below shows the hypothetical growth of $1 invested since 1926. It is immediately apparent that both parties governed through periods of substantial growth and decline. Significantly less apparent is evidence to suggest that either party presents a greater tendency to produce stronger or weaker market results.
Hypothetical Growth of $1 Invested in the S&P 500
 S&P data © 2022 S&P Dow Jones Indices LLC, a division of S&P Global. Graph produced by Dimensional Fund Advisors. All rights reserved.
It’s easy to get caught up in political scare tactics, but making investment changes based on unknown election results could prove riskier than sticking to a principled approach. Patient investors are rewarded by not trying to outmaneuver the unpredictable. This election cycle, don’t let political ghouls distract you from your investment goals.
